Analytics Guide
Early game spoiler warning!
This guide covers the different parts of the HKViz gameplay analytics page. Open it from one of your gameplays on the start page or from the public gameplays page.
If you want to learn how to record analytics while playing Hollow Knight, check out the Gameplay Recording Guide.
Overview
Click on the section you want to know more about:
Contents
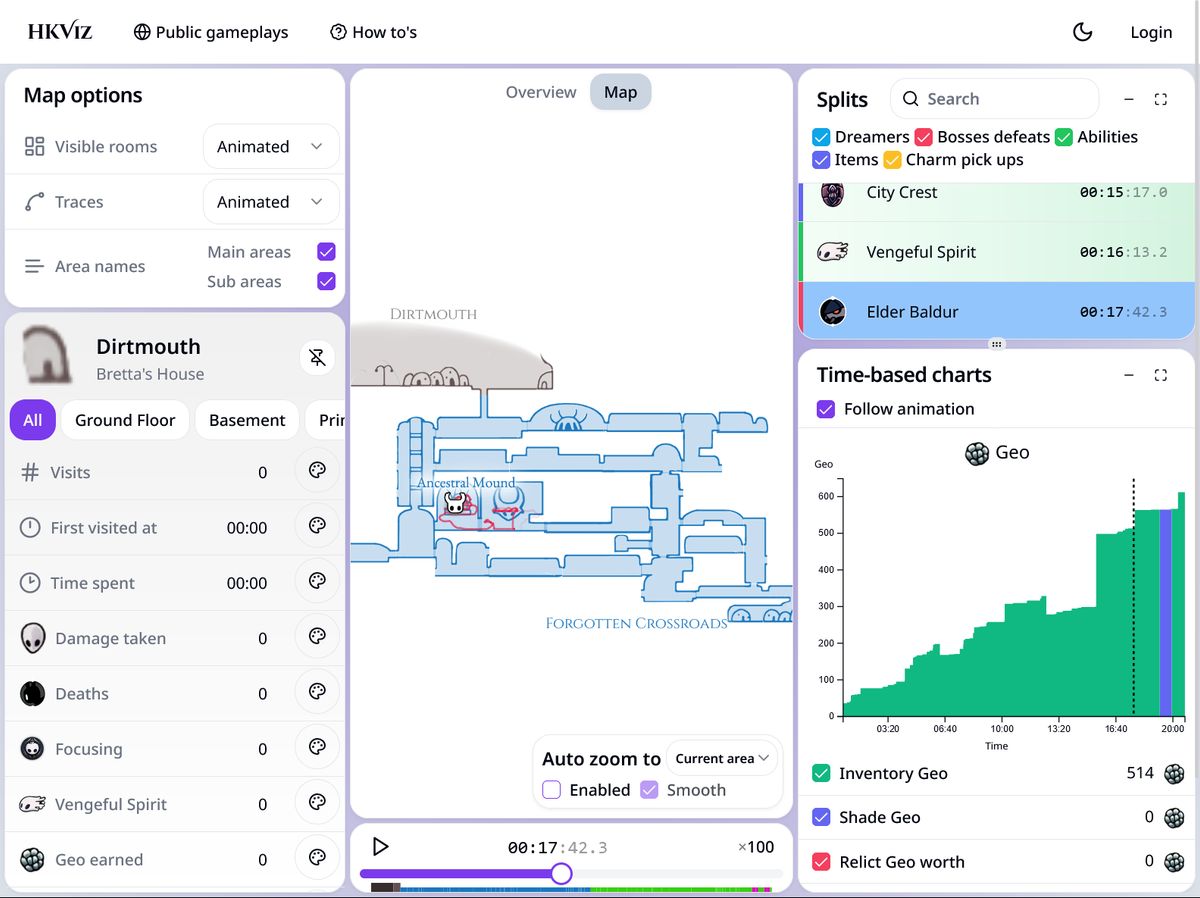
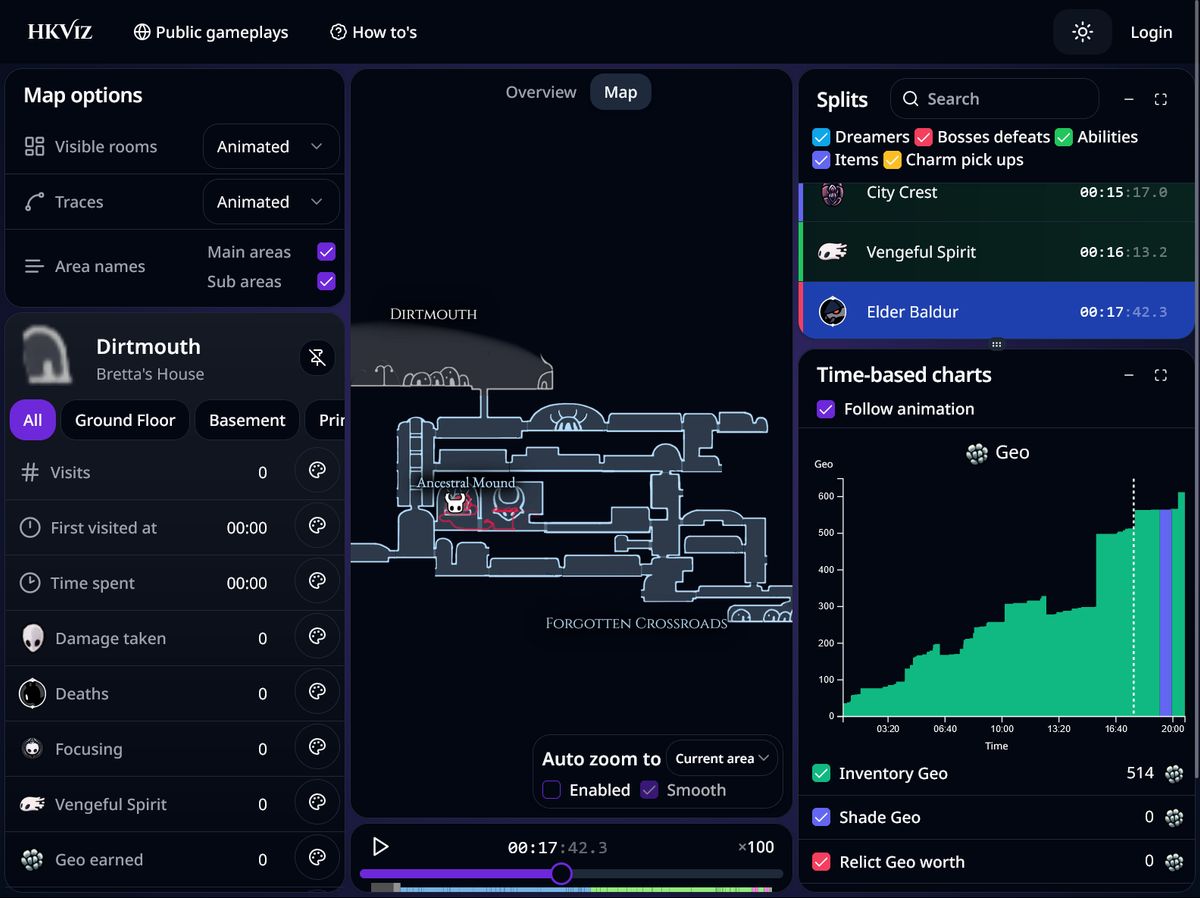
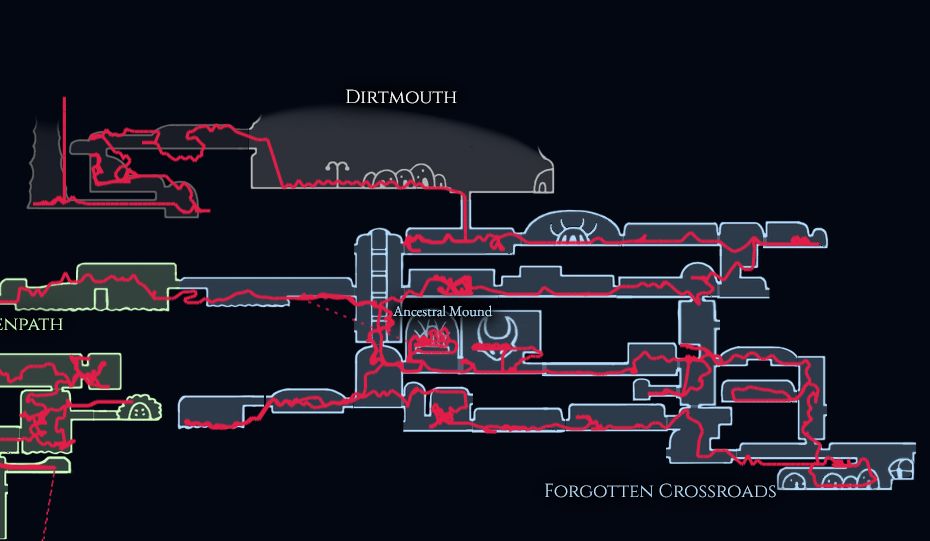
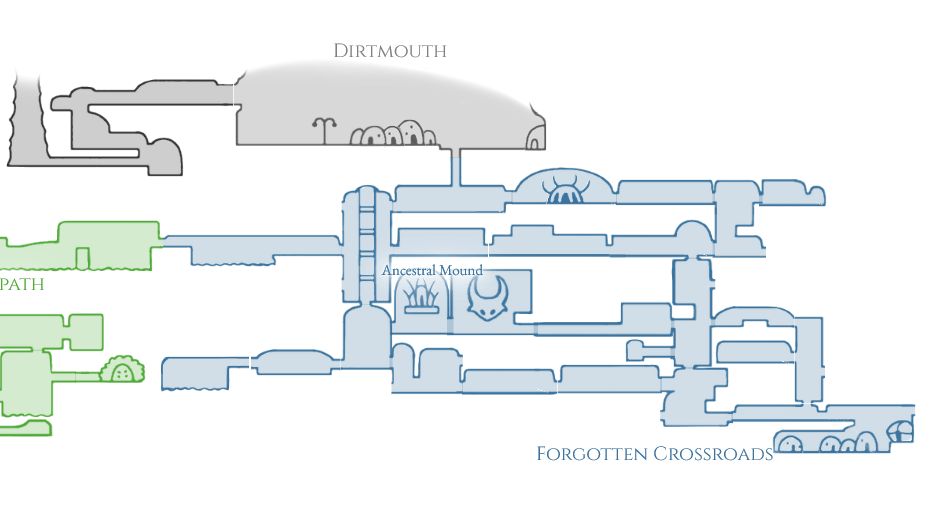
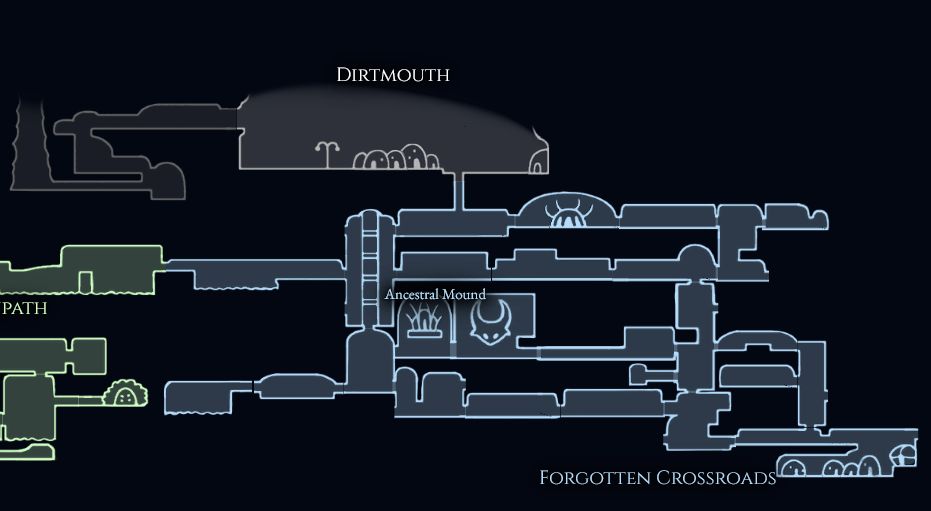
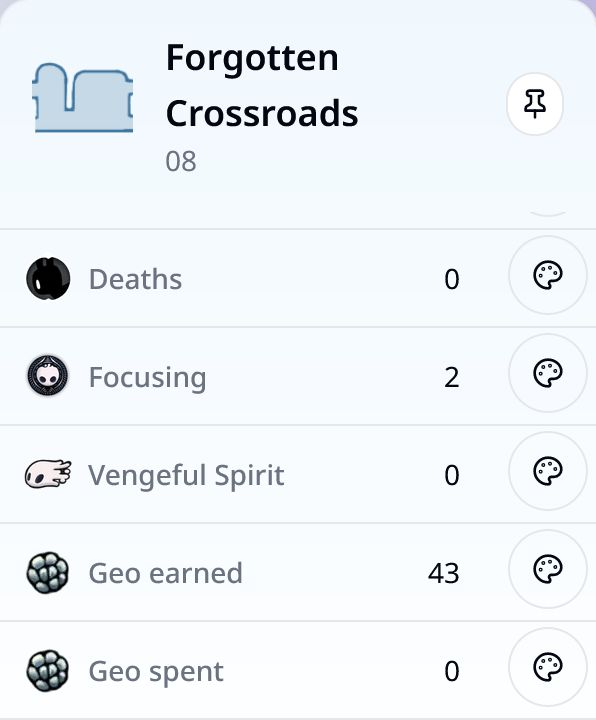
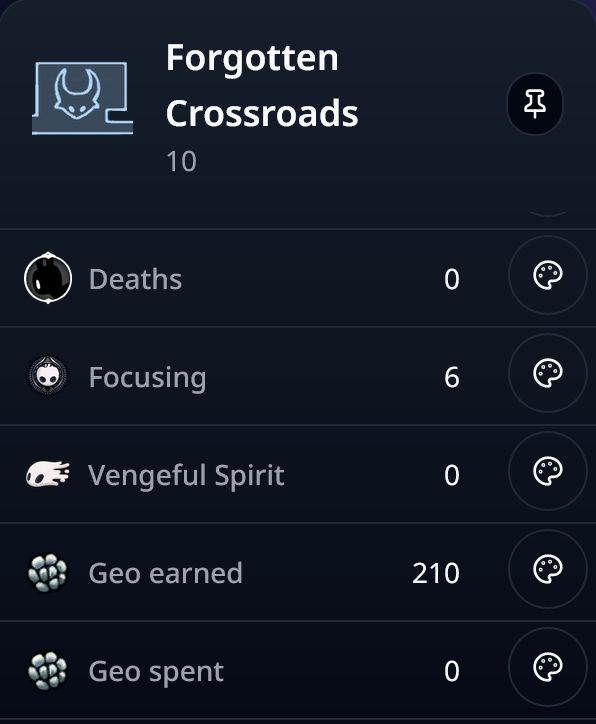
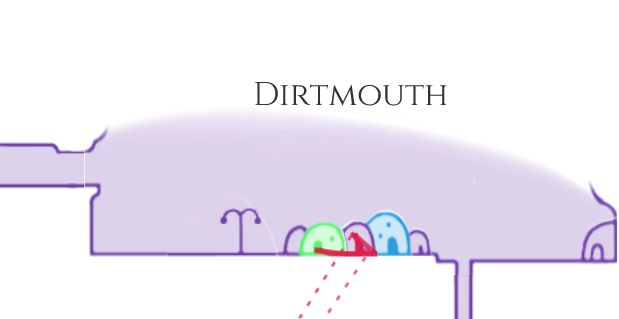
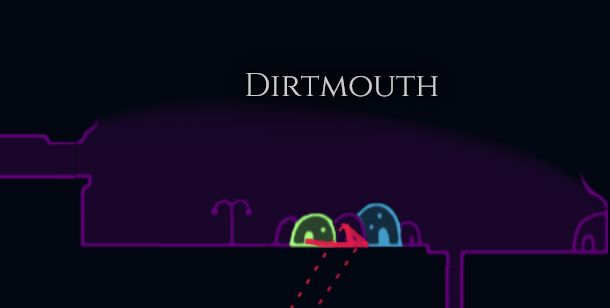
Map
The map is the main part of the analytics page. It is similar to the in-game map, but includes a few helpful modifications.
It can show player movement as traces, visited rooms, and other stats by recoloring the map.
Player movement and traces
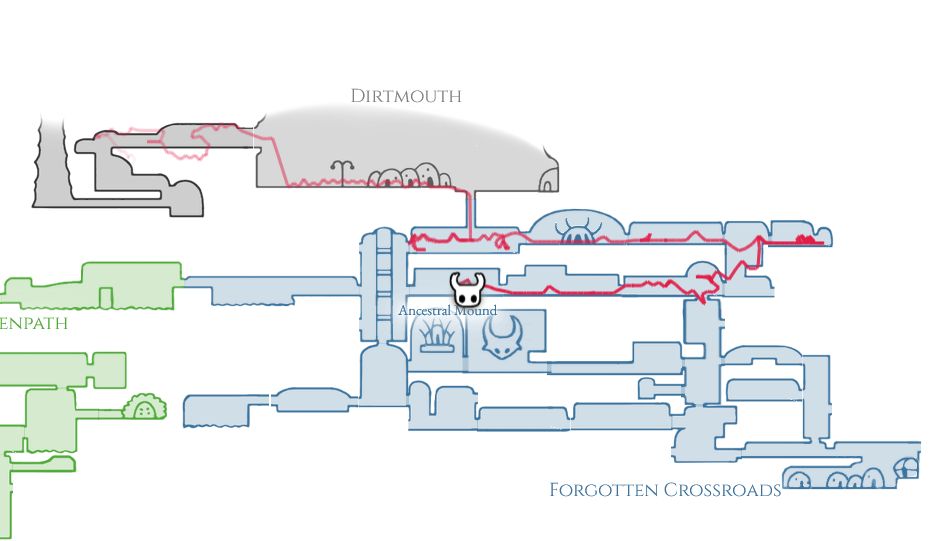
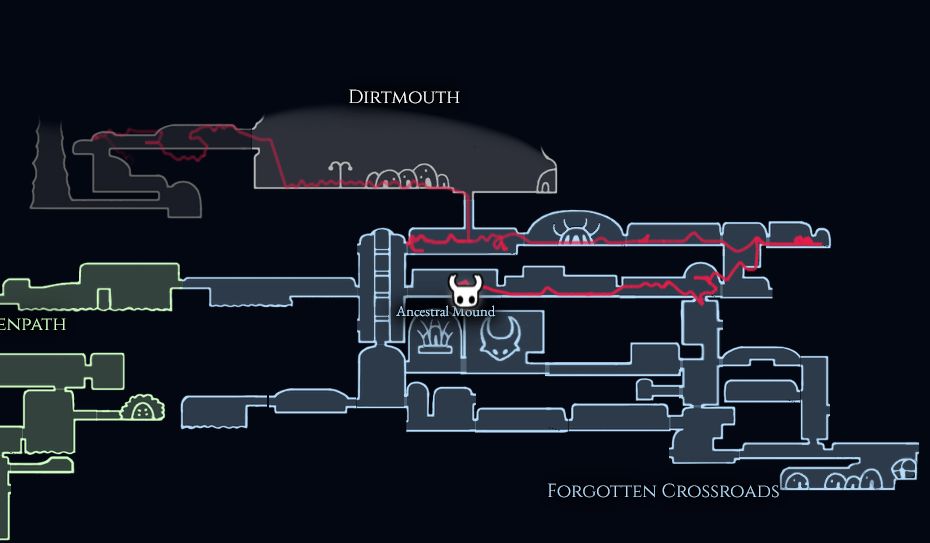
Shows the last 5 minutes of player's movement as a trace. Positions further in the past are faded out.
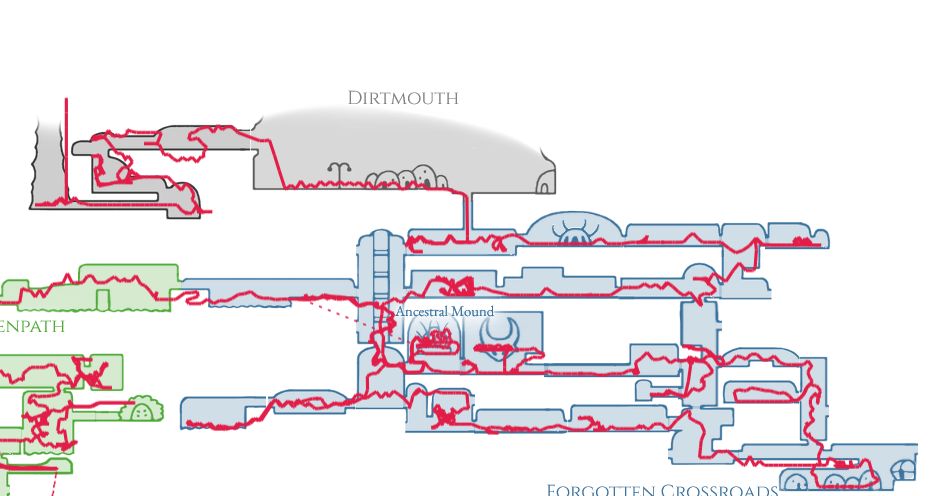
Shows the player's movement of the complete gameplay at once.
Hides the trace. This can be useful, if you want to look at a variable on the map, without the trace covering it.
Room visibility
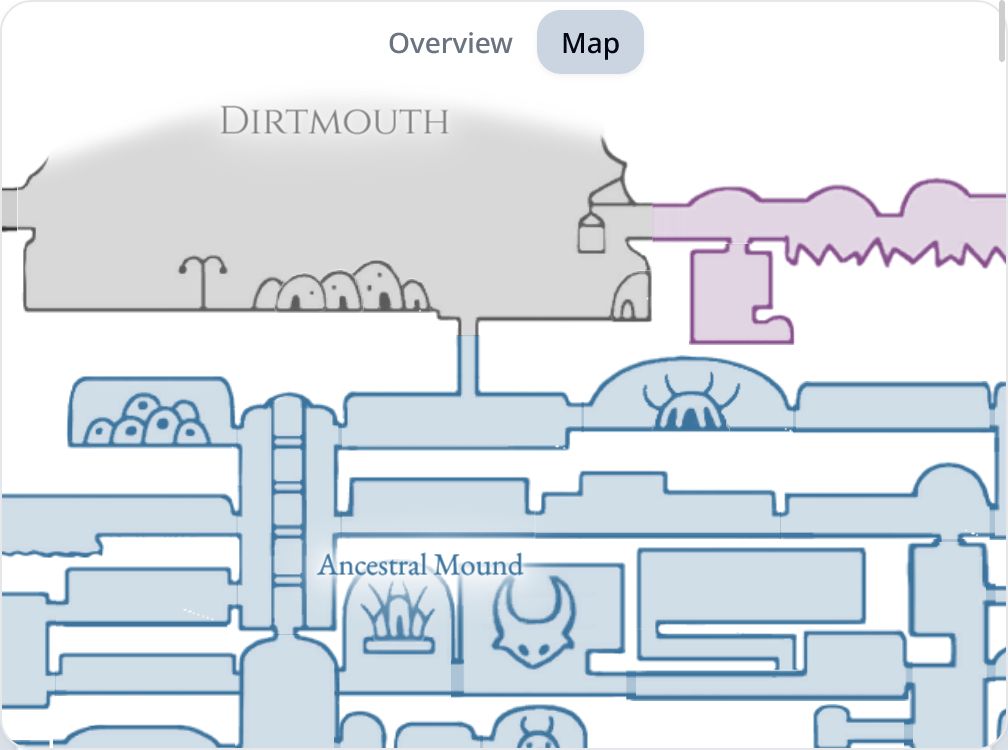
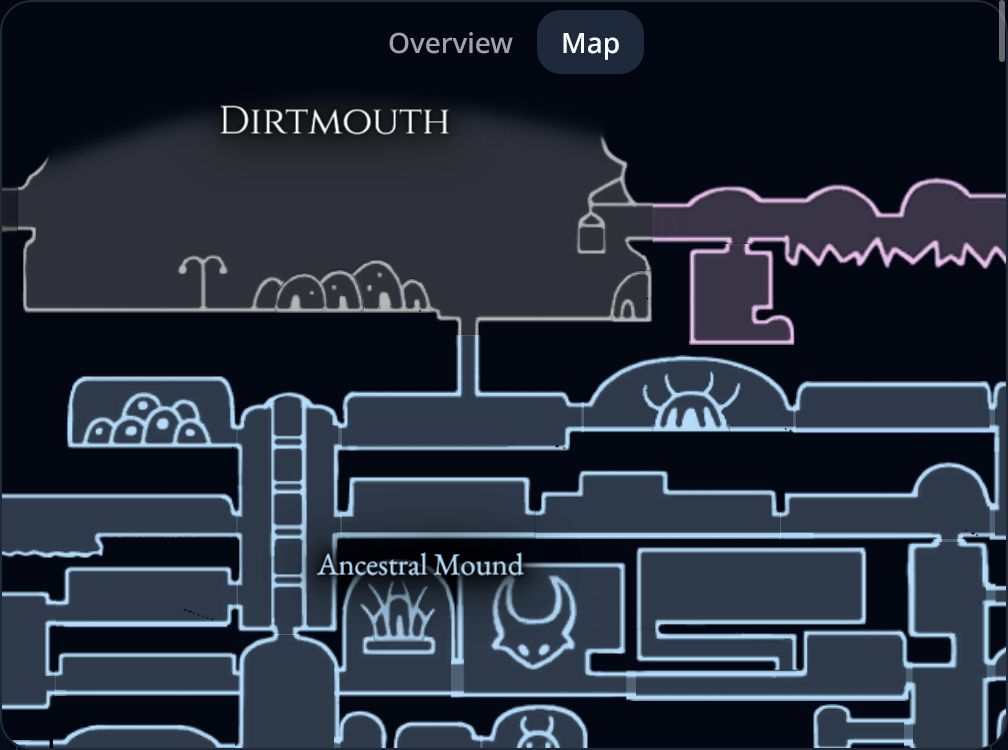
Room visibility controls which rooms are shown. Choose between three options:
Rooms appear once they are visited in the gameplay, based on the time selected in the timeline.
Useful for following the progression of a gameplay.
All rooms visited at any point in the gameplay are shown. Not affected by the timeline.
Useful when you want to analyze variables by recoloring the map.
Even rooms that were never visited in the gameplay are shown.
Helpful for spotting rooms that were missed.
Map coloring by variables
Coloring the map based on different game stats can help you spot interesting or difficult parts of a gameplay.
How it works:
-
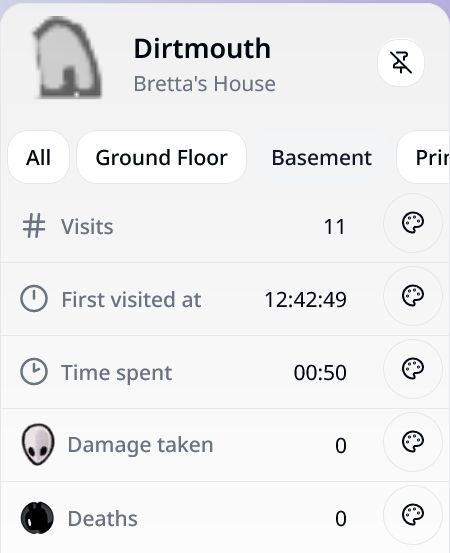
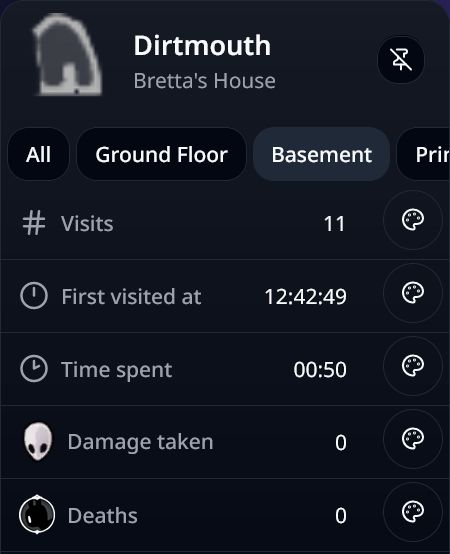
Select a room by hovering over it on the map. Its stats appear in the room analytics.
Hint: the selected room is also highlighted in the timeline.
- Pin a room: To keep the selected room from changing while you hover over other rooms, pin it with the button in the area analytics panel or by clicking a room on the map. You can also pin rooms by clicking the color code at the bottom of the timeline or by double-clicking a split.
-
Select a variable for coloring: Click the button in the room's info panel to pick the stat used for coloring.
-
Color scales: Clicking the button cycles through the available color scales.
Color scales:
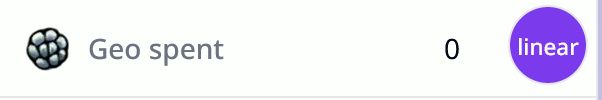
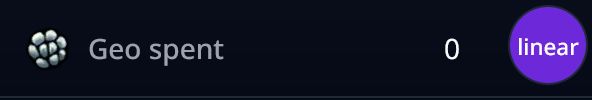
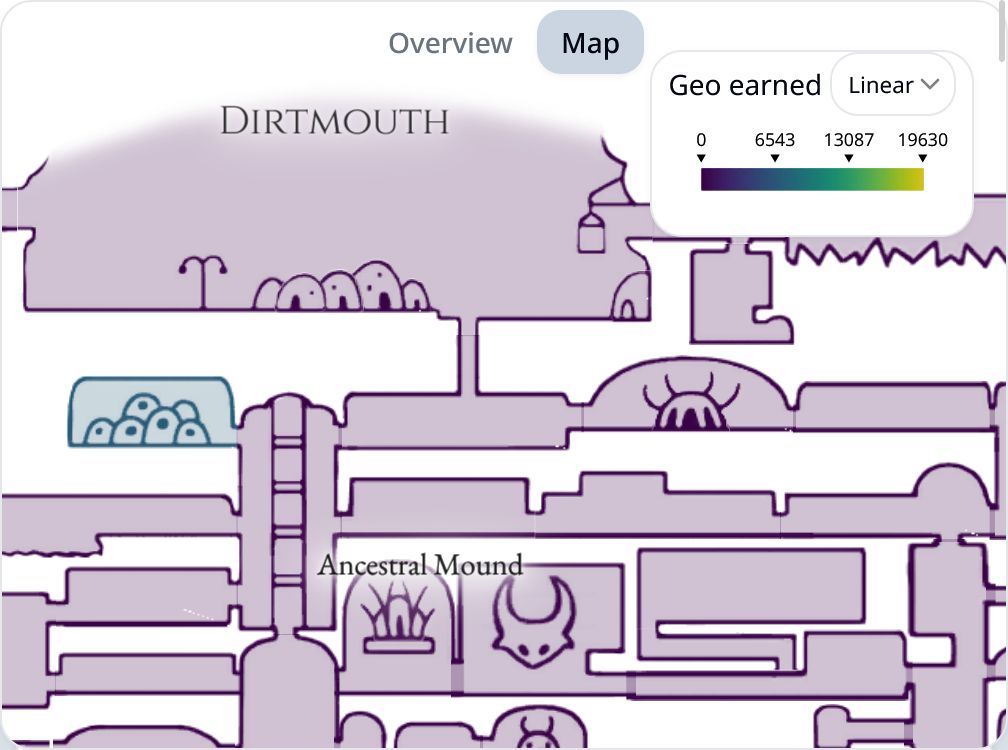
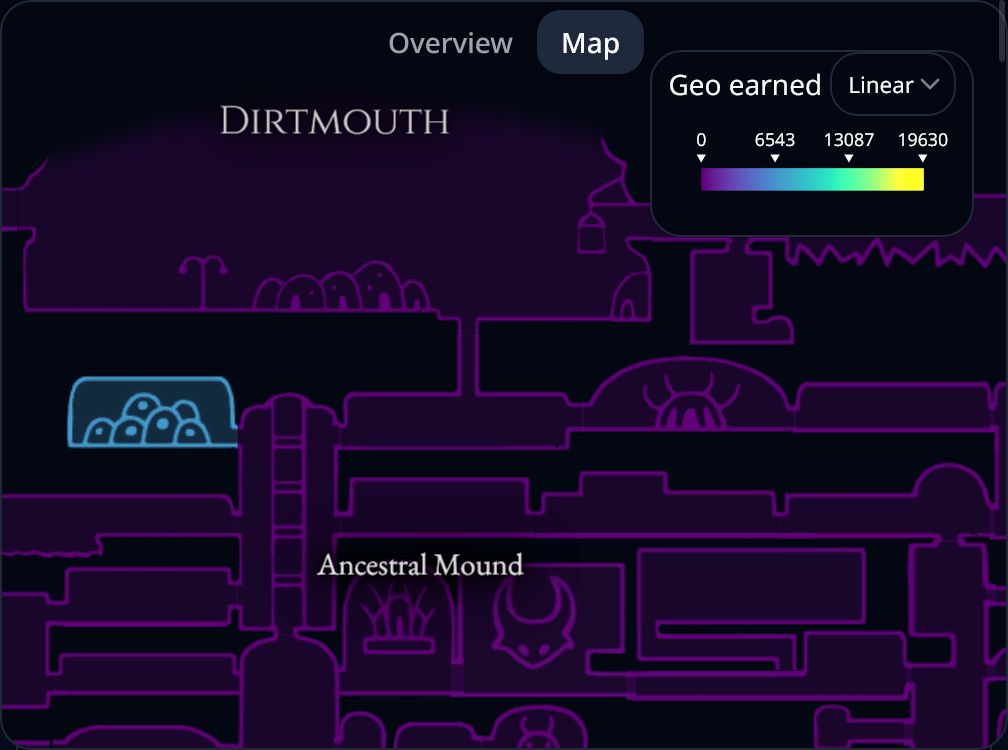
The first click on the button colors the map by the selected variable using a linear scale. This works best for variables like first visiting time, where values are usually spread fairly evenly.

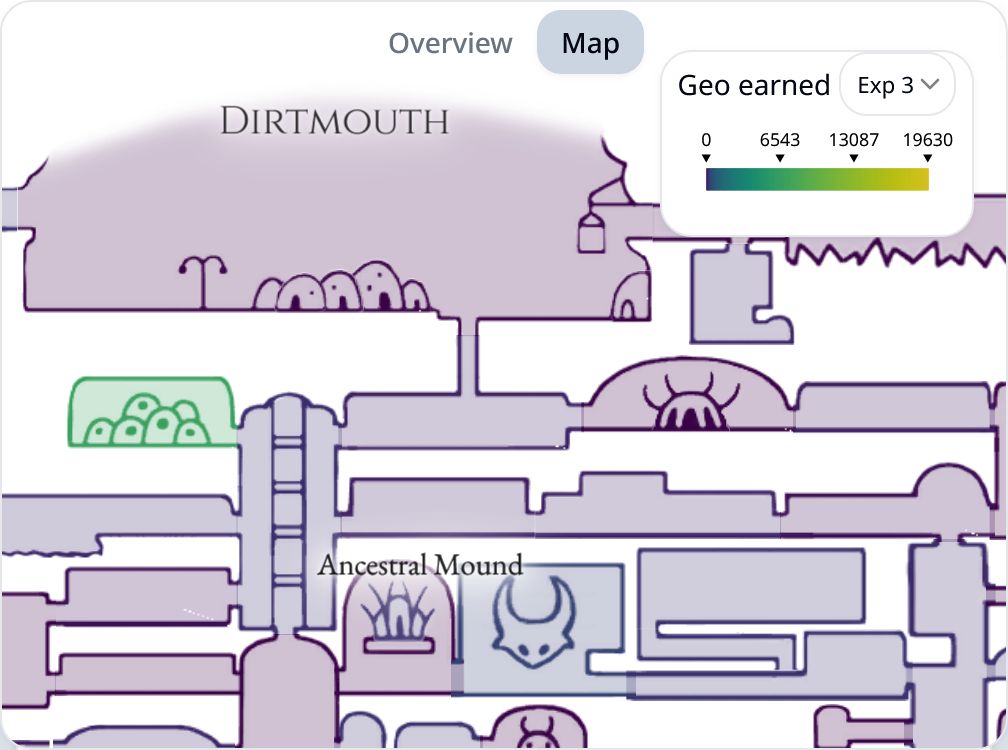
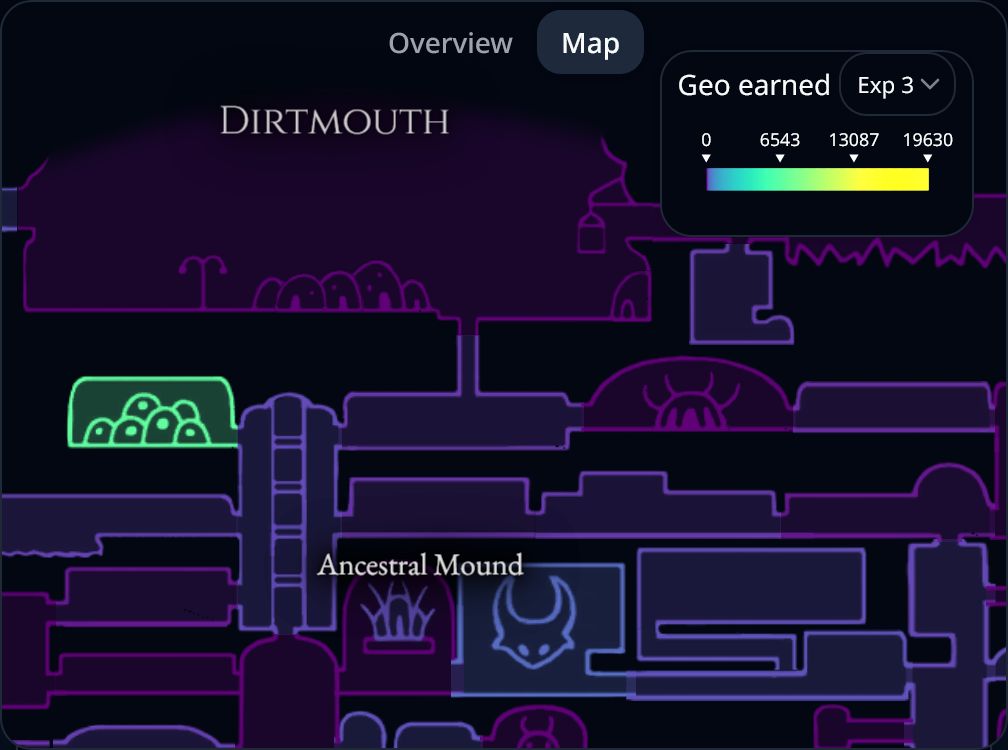
A second click on the button switches to an exponential scale.
For many variables, only a few rooms have high values while many rooms have low values. An exponential scale makes the low values easier to compare. This is especially useful for geo spent, since most geo is spent in only a small number of shops.

Clicking the button a third time switches back to coloring the map by area, matching the in-game map.
Additional color scales are available from the dropdown menu in the top right of the map after selecting a variable with the button.
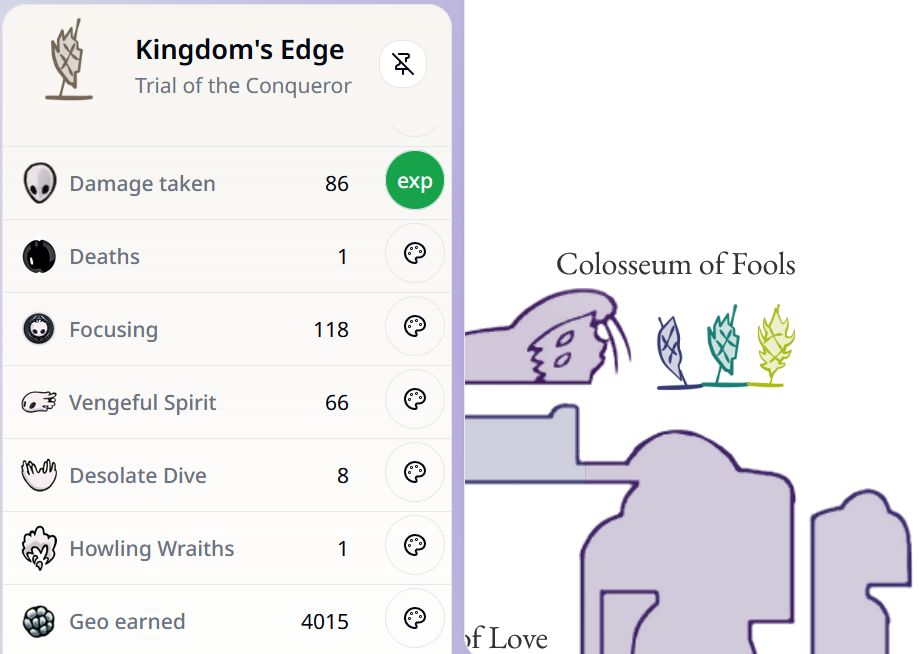
Available stats:
- Visits:
Number of times this scene/area has been entered. - First visited at:
Time of first visit - Visit Order:
The order this scene or area was first visited (e.g., 5 means four others were first visited before it). - Time spent:
Total time spent in a scene/area of all visits combined. - Damage taken:
Total damage taken in masks - Deaths:
Number of times the hero died in a scene/area. - Focusing:
Number of times healing was started. - Vengeful Spirit:
Number of times a fireball Spell was used. - Desolate Dive:
Number of times a downwards Spell was used. - Howling Wraiths:
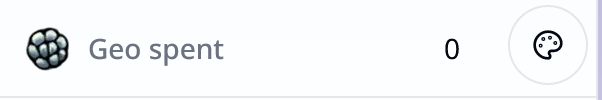
Number of times an upwards Spell was used. - Geo earned:
Does not include Geo earned by defeating the Shade. - Geo spent:
Does not include Geo lost by dying and not defeating the Shade. - Essence earned:
Essence obtained by e.g. defeating dream bosses, or collecting orbs from whispering roots. - Essence spent:
Essence spent by using the dream gate.


Special rooms
The map in HKViz includes a few changes so more areas can be analyzed. These include added maps for Godhome, White Palace, and Birthplace, plus a few other adjustments:
Buildings
Some parts of the Hollow Knight world are not shown directly on the map, but are hinted at by a building or door. For HKViz these have been cut out from the game sprites so analytics for them can be shown individually.
In the game, the player location is hidden inside these buildings. In HKViz the player movement is shown on top of them.
Multi-room buildings
Some buildings contain multiple rooms. On the map, analytics are shown for all rooms inside the building together. (For example, deaths are summed across all rooms, and "first visited at" uses the earliest room visit.)
Click the building on the map to view analytics for each room individually.
Other examples of multi-room buildings on the map are:
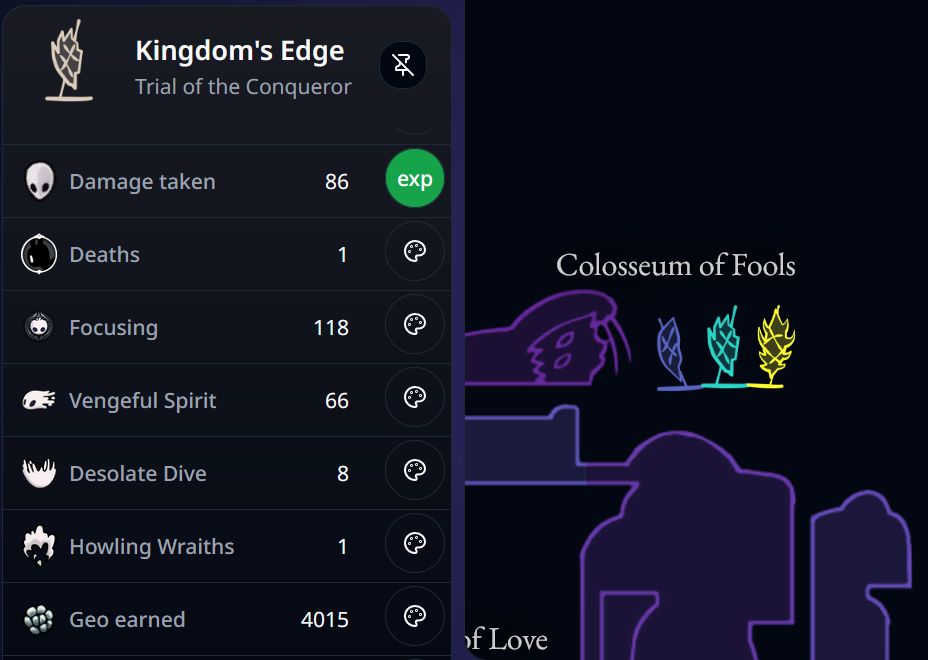
Colosseum
Unlike on the in-game map, each trial of the Colosseum has its own sign on the map, which makes it easier to see room analytics such as how often you died in each one.
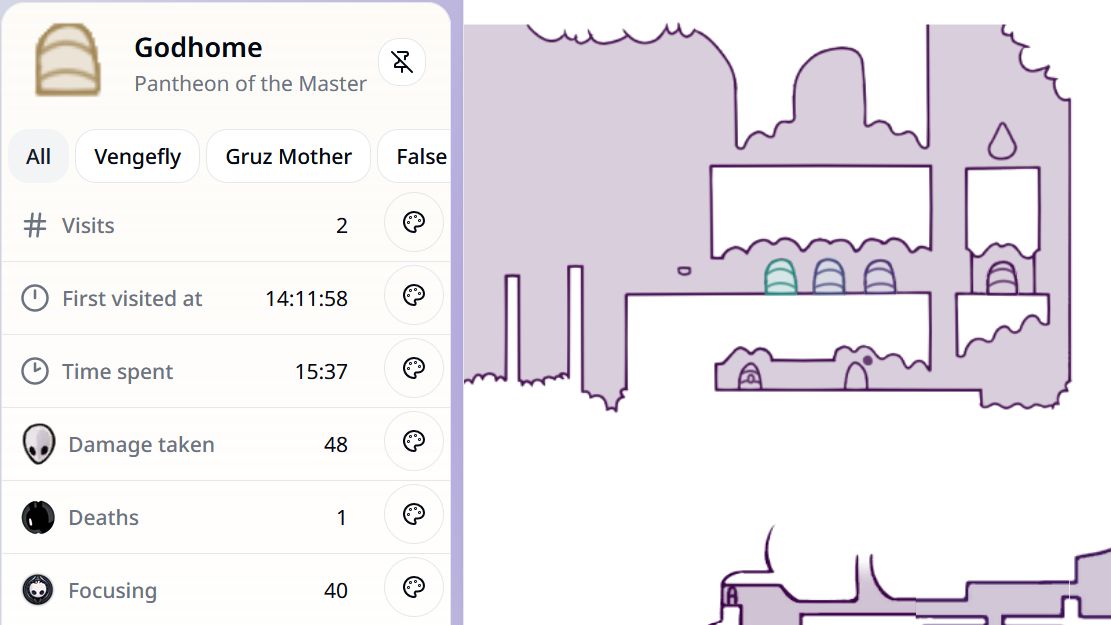
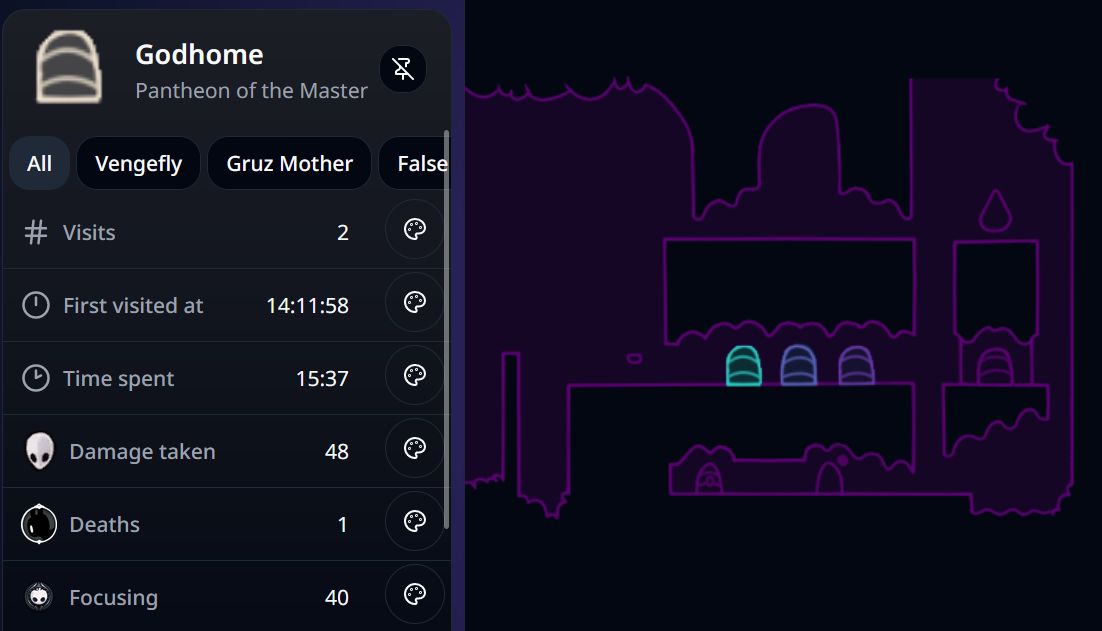
Godhome
On the map, information for each pantheon or boss rush is displayed at its entrance.
By clicking one of the doors, you can see the overall analytics of the selected pantheon. Analytics can also be displayed for each boss individually by clicking one of the bosses above the analytics, similar to other multi-room buildings.
Splits
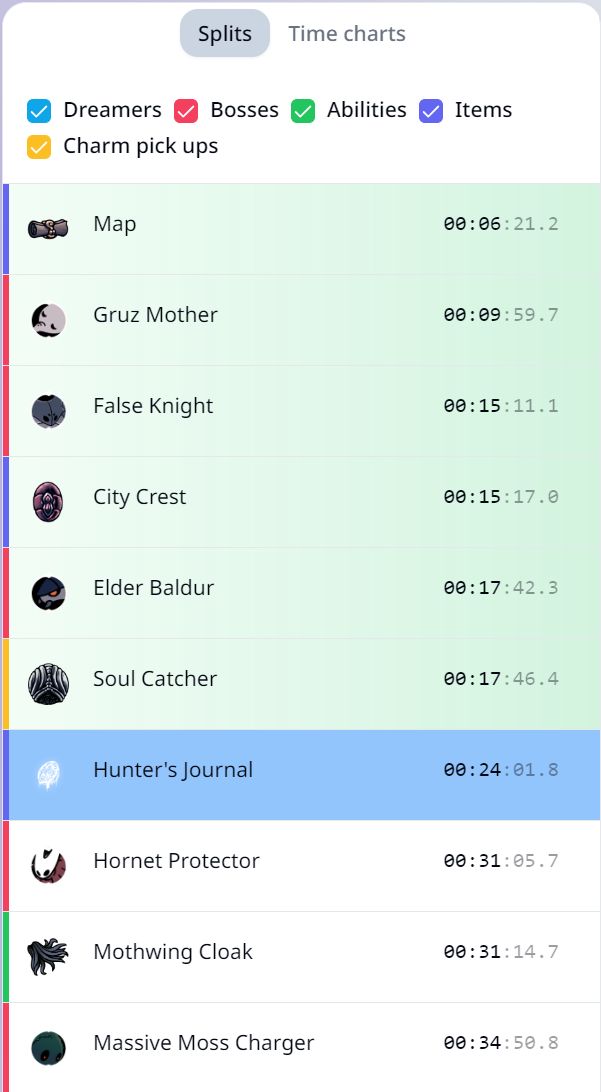
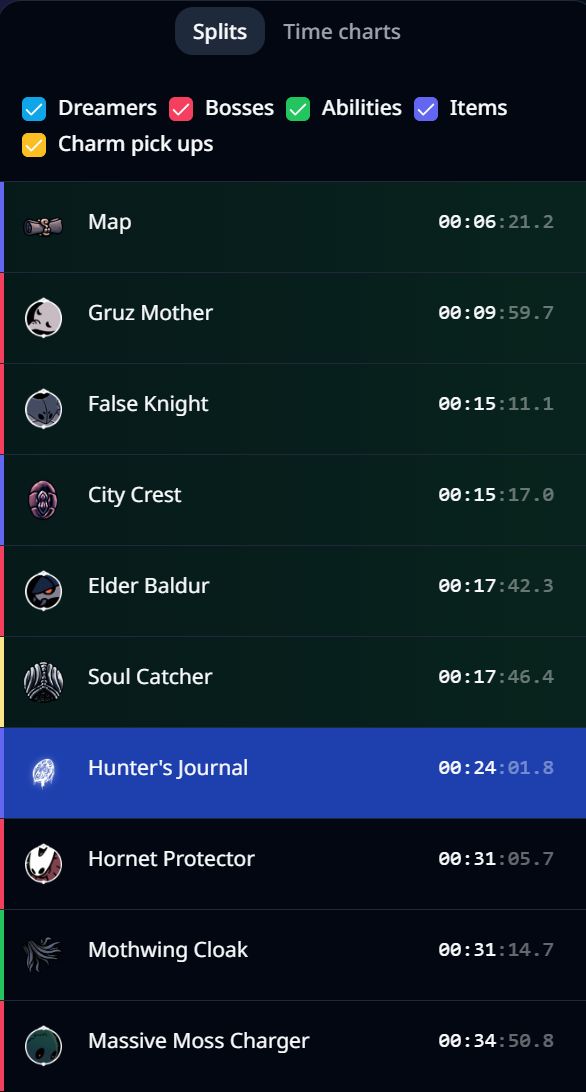
The splits view gives a quick overview of what happened during a gameplay. It shows the times of events of the following types:
- Dreamers
Broken Dreamer seals - Bosses
Defeated bosses. Not including bosses which are fought again in Godhome. - Abilities
Obtained abilities. (E.g. spells) - Items
Collected items (e.g. the map or delicate flower). Not including charm collections and relicts. - Charms
Collected charms and charm upgrades
By toggling the checkboxes corresponding to the event types, the splits can be filtered to only show the events of interest.
Splits actions
| Shortcut | Action |
|---|---|
| Hover | Shows a marker for the split on the timeline and highlights the room of the split on the map. |
| Click | Jump to the timepoint of a split and change the selected room of the area analytics panel to the room of the split |
| Double Click | Pin the room of a split |
Time-based charts
The time-based charts show variables over time, such as completion percentage, geo, and grubs collected.
Hovering over a chart shows a marker on the timeline. The player position is also highlighted on the map.
Time-based chart actions
| Shortcut | Action |
|---|---|
| Drag over Chart | Zoom in |
| Click | Zoom out |
| Ctrl+Click or Click+Hold | Move the timeline to where your mouse is on the chart |
| Ctrl+Drag | Move the timeline to where your mouse is on the chart until letting go |
 Geo chart
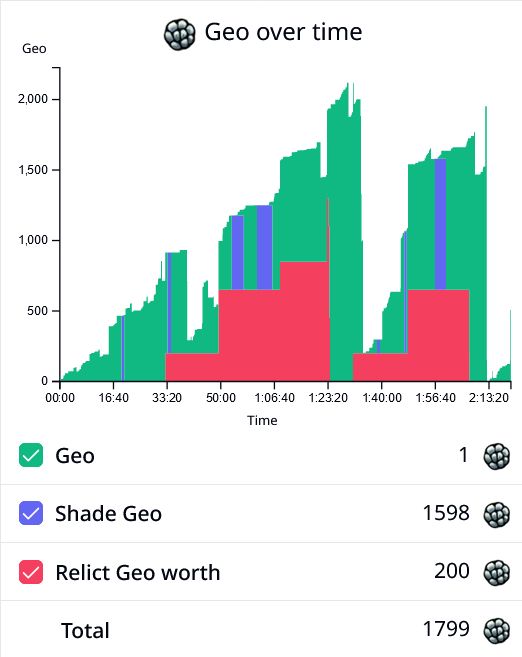
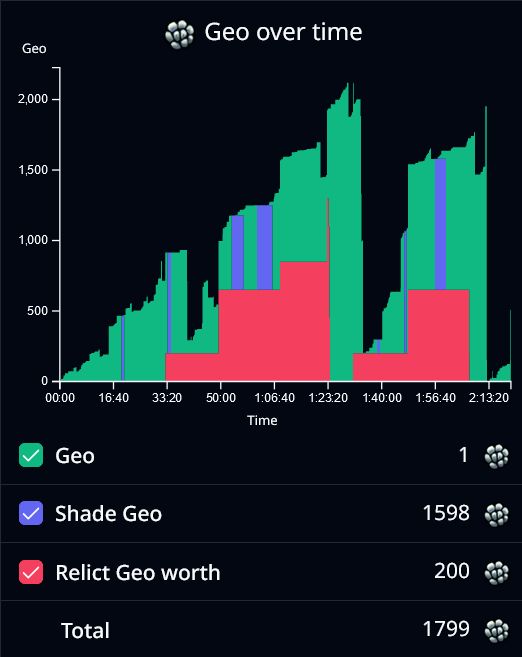
The Geo chart shows Geo over time. By default it shows the geo the Knight carries, plus the geo they could still gain from the shade or relics.
- Inventory Geo
Geo the player has. Upon death, it will be transferred to the shade. - Shade Geo
The Geo the shade has, which can be earned back by defeating the shade. - Relict Geo worth
The Geo worth of all relicts in the inventory when sold to Lemm. - Total
The total of the variables above. I.e. Geo the player would have if the shade is defeated and all relicts are sold.
Hint: you can find out when Geo was lost by failing to defeat the shade by looking for spots where "Shade Geo" decreases without "Inventory Geo" increasing.
 Essence chart
The Essence chart shows Essence collected over time.
- Essence
Essence collected
 Grubs chart
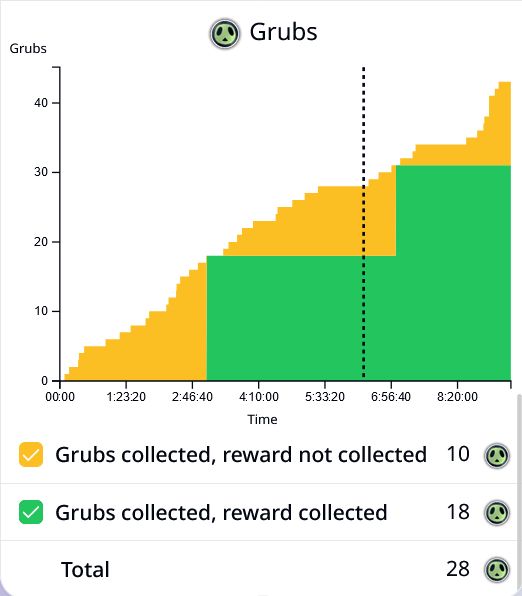
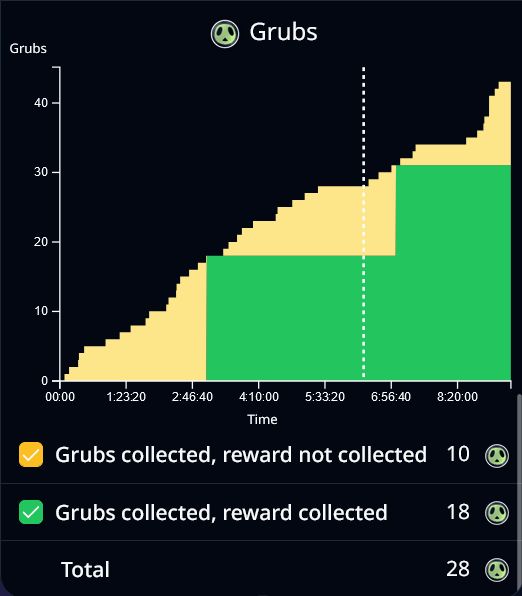
The Grub chart shows the number of grubs collected over time and how many rewards have been claimed.
- Grubs freed, unrewarded
These grubs have already been freed from their glass jars, going to the grub father will reward you for freeing them. - Grubs freed, reward collected
These grubs have already been freed from their glass jars and the reward from grub father has been collected as well. - Total
Total number of grubs freed from their glass jars.
Completion chart
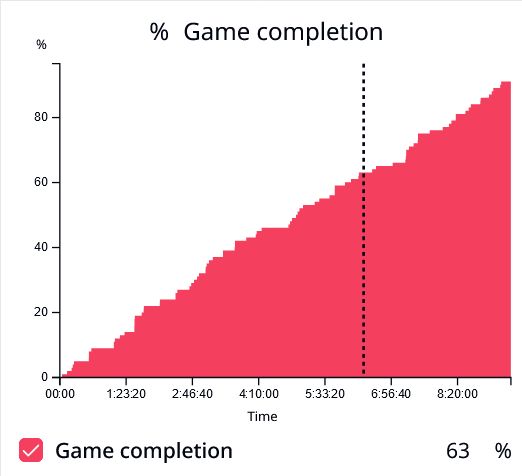
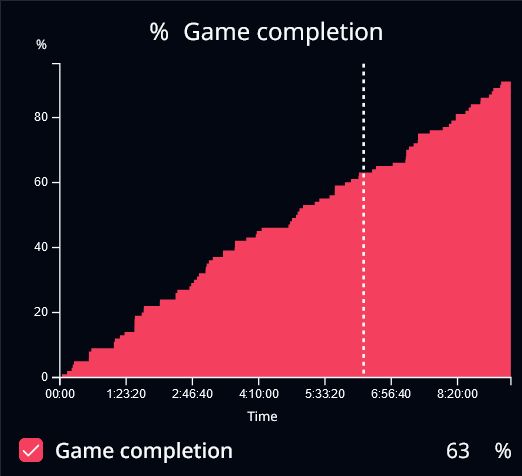
The completion chart shows completion percentage over time.
- Game completion
Percentage of the game completed.
 Health chart
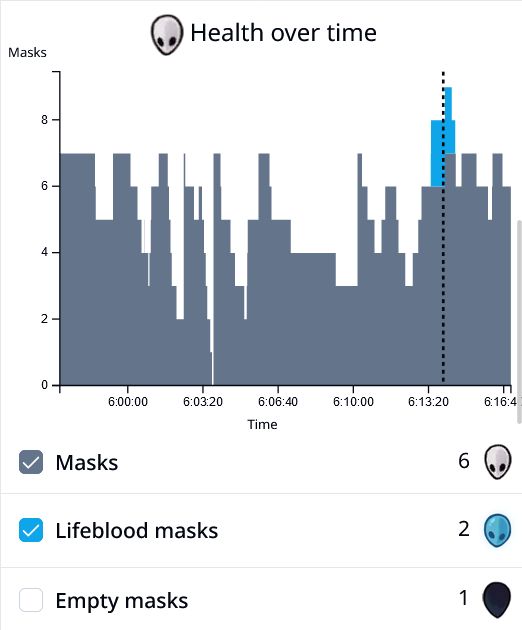
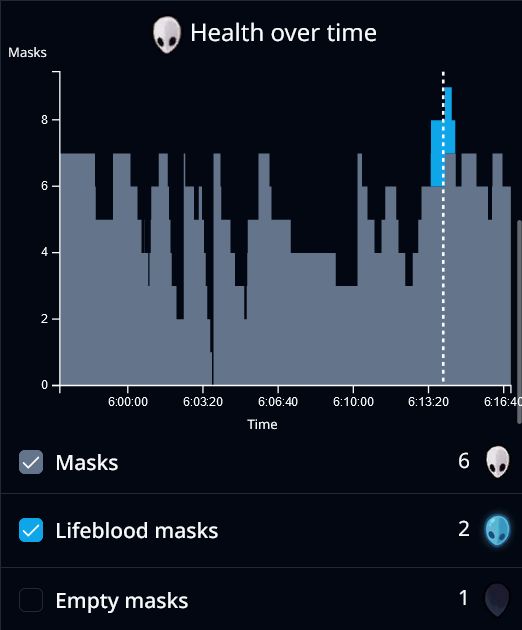
The health chart shows masks over time. Since health changes very frequently, this chart is most useful when zoomed in closely.
- Masks
The players health. - Lifeblood masks
The players additional health from lifeblood masks. - Empty masks
The currently empty masks, which can be healed back up.
 Soul chart
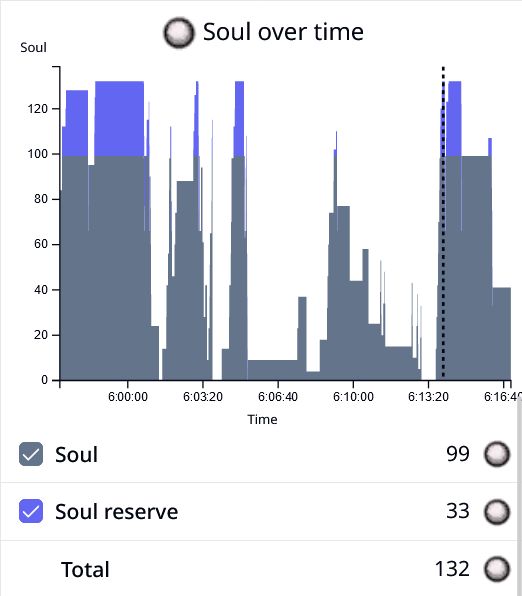
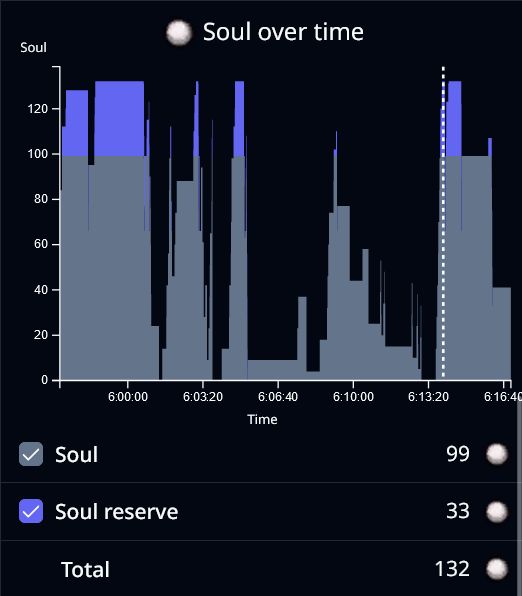
The soul chart shows soul over time. Soul is used for spells and healing, and is gained by:
- hitting enemies with the nail
- dreamnailing enemies or NPCs
- and some other sources
Since soul changes very frequently, this chart is most useful when zoomed in closely.
- Soul
How much soul is in the soul meter (from 0 to 99). Healing and spells use 33 soul per use. - Soul reserve
Soul inside the soul vessels (up to 33 per vessel). - Total
Total soul in soul meter and reserve.
Timeline
The timeline lets you scroll through a gameplay and inspect player location and room visibility at different points in time. On the right side, you can adjust the animation speed.
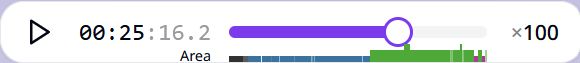

At the bottom of the timeline, the colors of visited scenes are shown. By selecting a room on the map, the color codes for the selected room and area are enlarged. This makes it easier to see when a specific area was visited.
Timeline slider shortcuts
| Shortcut | Action |
|---|---|
| Shift+Drag | More precisely drag on the timeline. The slider moves 10 times slower, making it easier to find a certain timestamp. |
Timeline color code shortcuts
| Shortcut | Action |
|---|---|
| Click | Jump to the timepoint of the color code |
| Hover | Change selected room, if not pinned |
| Click+Click | Toggle if the selected room is pinned. |